DataRead
This tool visualizes the contents of a .data file with multiple views plotting a variety of channels, providing insights about the source tests for a variety of use cases.
DataRead Staging
From the Dashboard, go to Tests > DataRead.
You should now see a list of uploaded .data files in a table as well as an interactive file upload utility.
Upload Data File(s)
You can either drag multiple files from your local file explorer or select "Browse" to choose .data files for upload. Once uploaded, the files will automatically appear in the table below the utility.
Note: The file upload component includes a note about the maximum file size allowed for upload. If you would like to change this value and have the appropriate permissions, navigate to Advanced > Global Settings and scroll down to the DataRead Settings section. There, you should see a field to edit the maximum upload size. Once the edit has been made, be sure to click the Save Settings button.
View List of Data Files
The table below the file upload lists all uploaded .data files that are available in the database. This table includes the file name, the file size, when the file was uploaded, and whether or not the file was uploaded as a Test Result. This list can be sorted by creation date or test result status. A filter above the top right of the table can be used to only list files uploaded during the current day. There are also options for viewing, processing, downloading, and deleting each file.
View a File in DataRead
To launch DataRead for a .data file, select the View button in the row of your file of choice. This will open DataRead in a new tab. It will take a few moments for DataRead to fetch all relevant data from the file.
On the left side of the page, you will see a snapshot of the currently-selected preferences and three collapsible sidebars: Plot Options, Data Options, and Display Options. To the right of these sidebars is the main plotting section. For some views, a table of metrics will be shown below the plots.
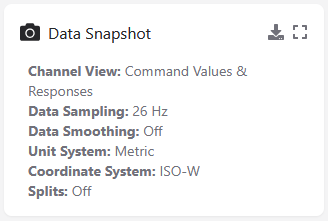
Data Snapshot
This snapshot provides an overview of primary options that are currently selected in the collapsible sidebars:
- Channel View: the current view selected in the Plot Options sidebar.
- Data Sampling: the current level of downsampling selected in the Data Options sidebar.
- Data Smoothing: the current filter, if any, applied to clean up the data, selected in the Data Options sidebar.
- Unit System: the current unit system selected in the Data Options sidebar.
- Coordinate System: the current coordinate system selected in the Data Options sidebar.
- Splits: the current source and type of split being displayed, as selected in the Display Options sidebar. This will be set to "Off" if the splits have been deactivated in the Plot Options sidebar.
Plot Options
Data Options
Display Options
Interacting with Plots
Metrics Tables
File Exports
To access the export modal, click the Download button in the top right of the Data Snapshot.
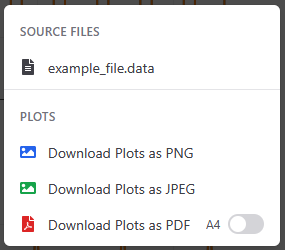
From here, you can download the source data file. You can also export the current plot view as a PNG, JPEG, or PDF. This plot export will include metadata about the file and the current tool selections. If exporting as a PDF, you can choose to toggle on the button that will force the exported file to have the preferred paper size.
Note: If you would like to change the preferred paper size, navigate to Advanced > Global Settings and scroll down to the File Evaluation Settings section. There, you should see a field to edit the default paper size. Once the edit has been made, be sure to click the Save Settings button.
No comments to display
No comments to display